Surface-to-Skeleton 3D Cephalometry: Estimating Hidden Skeletal Landmarks from CT-Derived External Soft-Tissue Surfaces

1Keio University, 2Tokyo Dental College
AI4M3D Workshop @ ECCV 2026 · Malmö, Sweden

The task at a glance: the external soft-tissue surface — the only model input — conceals the craniofacial skeleton and 21 skeletal target landmarks; three visible soft-tissue landmarks complete the 24-landmark configuration (colors follow the observability groups G0–G3). The bony surface is shown for orientation only; it is never a model input.
Visualization shows one representative case from the study cohort; no patient identifier is displayed.

TL;DR

Can internal skeletal landmarks such as Sella and Basion be inferred from the external 3D head surface alone? Using 240 clinical CT scans, we formulate a coordinate-consistent surface-to-skeleton task that isolates this question from registration, scanner-domain, and acquisition-state effects. An integrated hierarchical point-cloud model reaches 2.97 mm mean radial error on 21 skeletal landmarks — including 3.03 mm on deep, surface-invisible landmarks — and mismatch controls show the predictions are patient-specific rather than a population template.

Abstract

Existing 3D facial-landmark methods localize points on visible skin, but whether CT-defined internal skeletal landmarks can be inferred from external soft-tissue geometry remains unclear. We formulate a coordinate-consistent surface-to-skeleton task using same-acquisition CT-derived surfaces, separating estimation from optical-to-CT registration, scanner-domain, and acquisition-state effects, with coverage analyzed separately. From 240 clinical CT scans from two hospitals, we construct a locked retrospective protocol pairing CT-derived external soft-tissue point clouds with 21 skeletal landmarks and three visible soft-tissue landmarks. An integrated hierarchical point-cloud model achieves 2.97 mm mean radial error on skeletal landmarks and 3.03 mm on deep or surface-invisible landmarks in 40 held-out patients. Patient-mismatch controls support patient-specific signal beyond a fixed population configuration or global similarity alone, while coverage ablations indicate dependence on non-anterior geometry. Optical-transfer diagnostics reveal substantial coverage-related and global-configuration components, although deployable optical inference remains unresolved. These results answer the controlled feasibility question affirmatively and provide a basis for hidden skeletal landmark inference.

A Controlled Surface-to-Skeleton Task

Cephalometric landmarks quantify the spatial relations among the cranial base, maxilla, and mandible, and are normally identified on CT/CBCT — at the cost of ionizing radiation. External head surfaces, in contrast, can be captured radiation-free by optical 3D scanners. A direct optical-to-CT study, however, entangles many error sources: surface-to-skeleton ambiguity, cross-modality registration, scanner-domain shift, coverage, expression, and the time gap between acquisitions.

We therefore isolate the core scientific question first: does the external 3D head surface itself contain predictive signal for CT-defined skeletal landmarks? Both the input surface and the target landmarks are derived from the same CT acquisition, so no cross-modality registration is involved. The 24 target landmarks are grouped by surface observability, from directly visible soft-tissue points (G0) to deep, surface-invisible skeletal points such as Sella, Basion, and Foramen Ovale (G3).
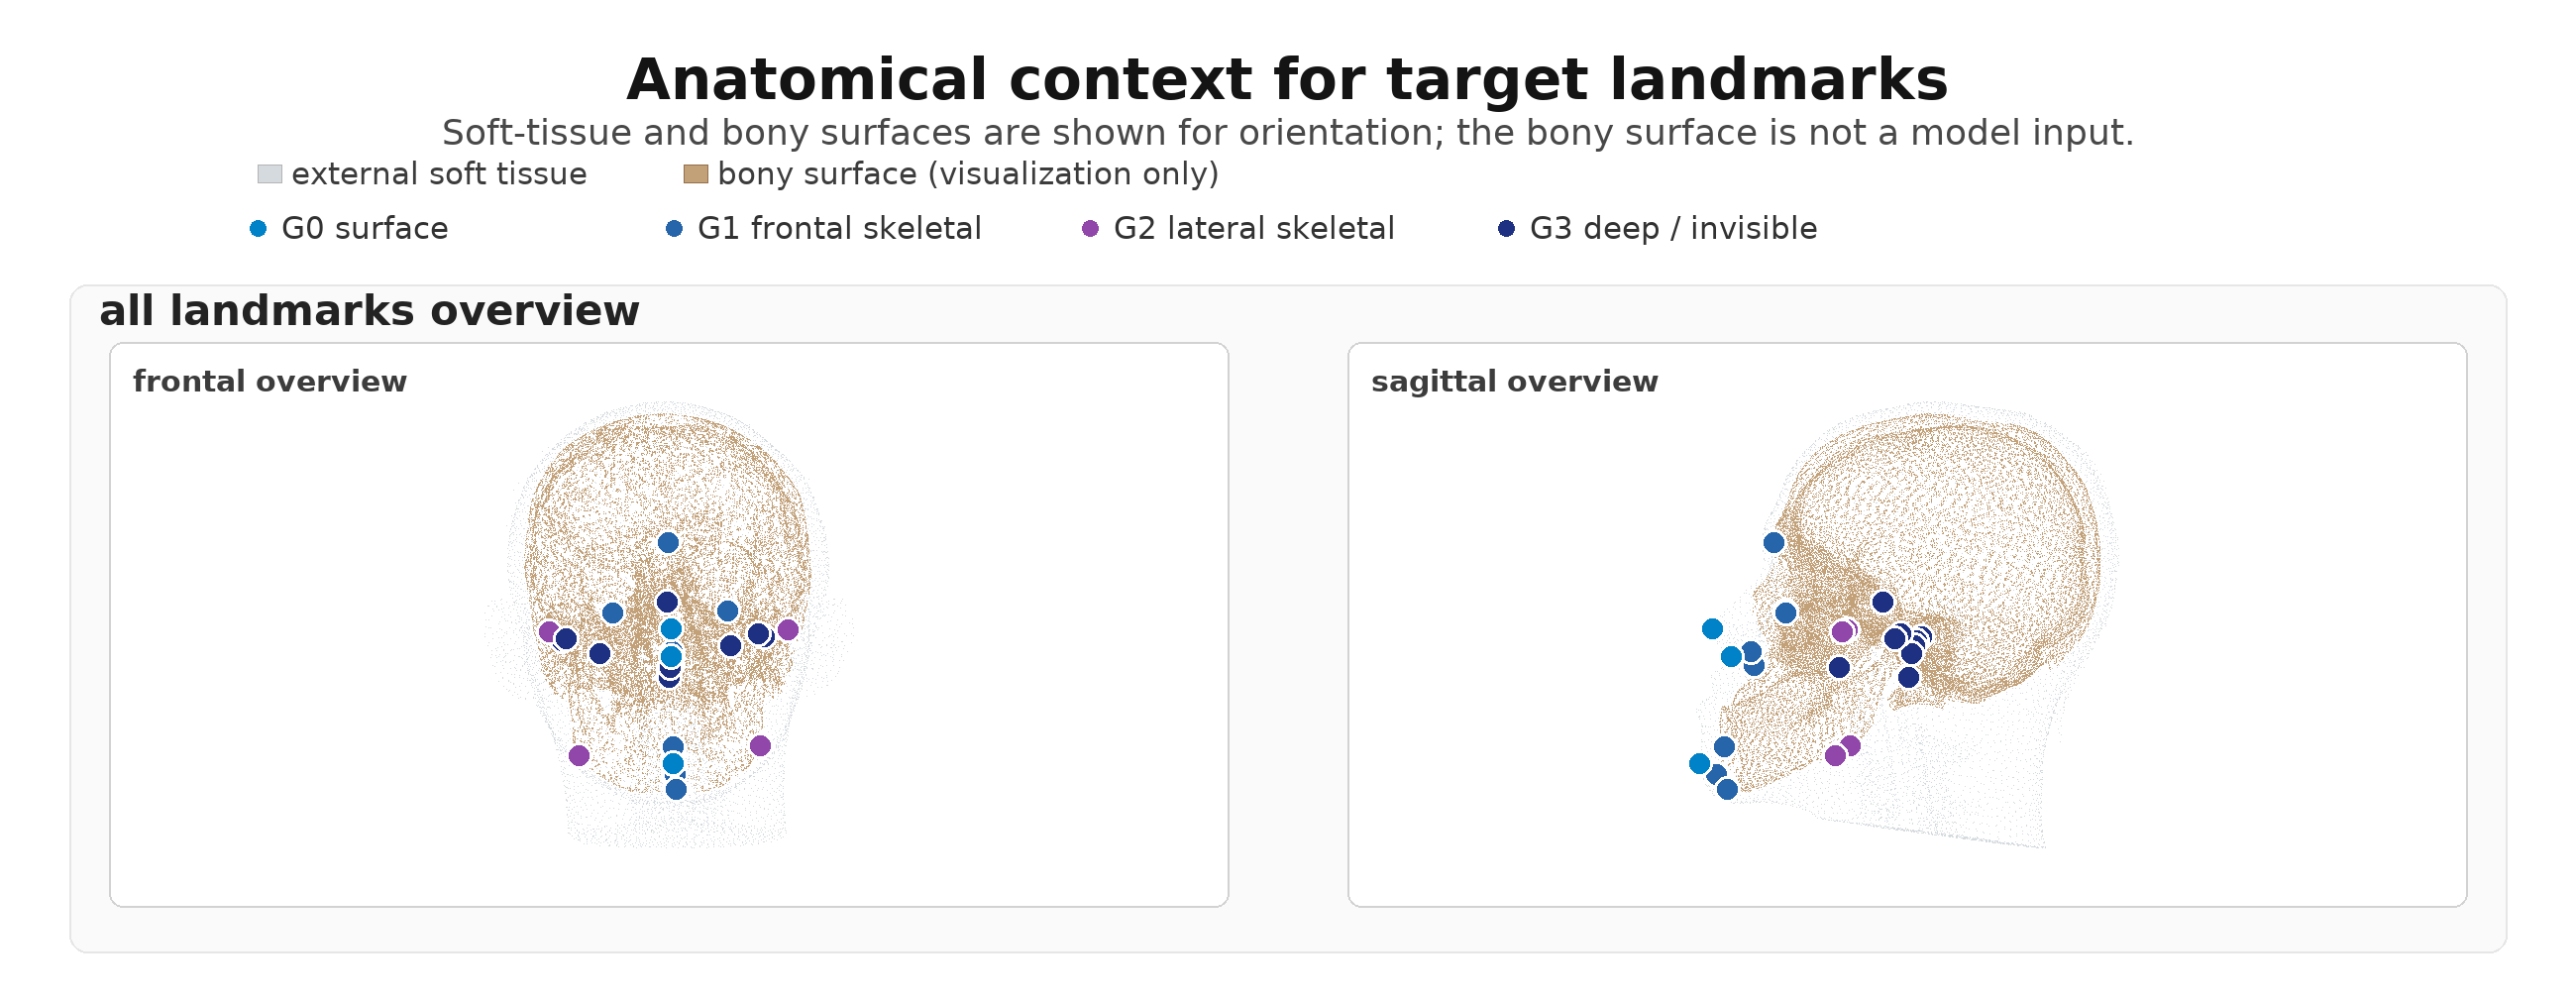
Anatomical context for the 24 target landmarks, grouped by surface observability from G0 surface points to G3 deep invisible points.

Target landmarks grouped by observability: G0 surface (3), G1 frontal skeletal (8), G2 lateral skeletal (4), and G3 deep / surface-invisible (9). The bony surface is shown for orientation only — it is never a model input.
Integrated Hierarchical Model

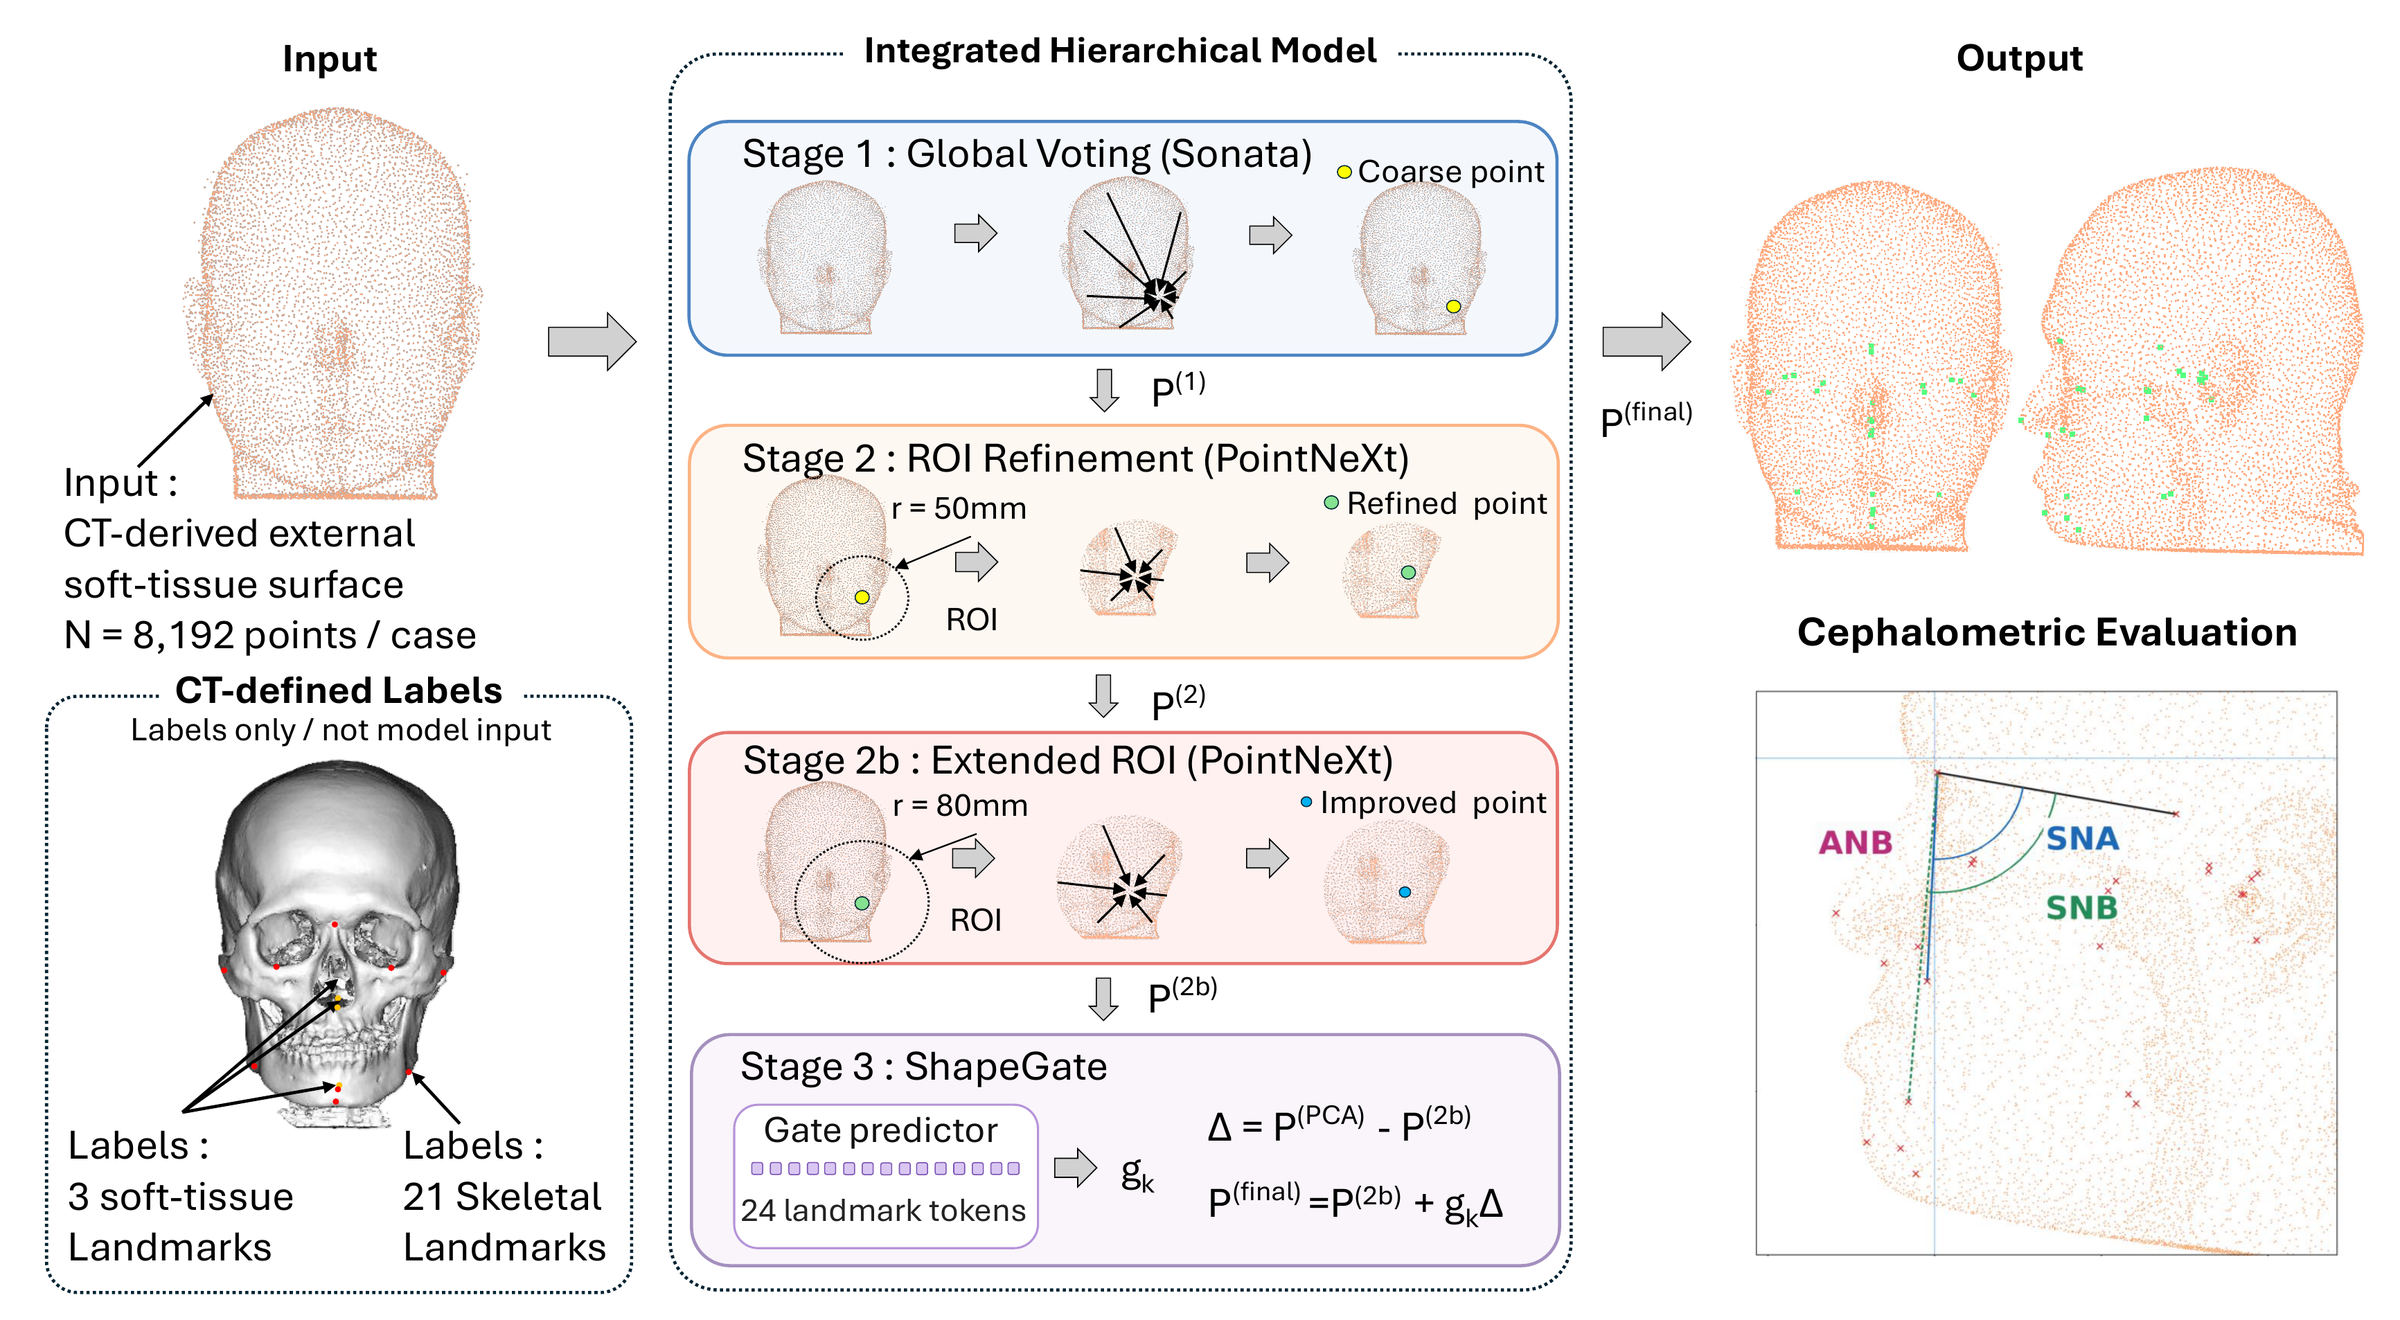
The model takes 8,192 surface points with normals and predicts all 24 landmarks in the registered CT frame through four stages: coarse global localization, two levels of local ROI refinement, and a conservative, gated statistical-shape calibration. Ablations show the ROI refinement drives most of the gain, while the final gate acts as modest calibration of the global landmark configuration.

Overview: a CT-derived external soft-tissue point cloud is processed by a four-stage hierarchical model to predict 21 skeletal and 3 soft-tissue landmarks, evaluated with cephalometric measurements.

The external soft-tissue point cloud is the only model input; CT-defined skeletal landmarks are labels, and the bony surface is never seen by the model.

Stage 1 — Global Voting

A fine-tuned Sonata (Point Transformer V3) encoder lets every surface point vote for each landmark with a predicted offset and confidence; the softmax-weighted centroid gives a coarse estimate.

Stage 2 — 50-mm ROI Refinement

A PointNeXt encoder refines each landmark within a 50-mm sphere around the coarse estimate, using relative coordinates, normals, and a landmark-identity code to predict a damped residual.

Stage 2b — 80-mm Extended ROI

Fourteen high-error landmarks — mostly lateral and deep ones — receive a second refinement with a wider 80-mm context, capturing craniofacial structure beyond the local surface patch.

Stage 3 — ShapeGate Calibration

A PCA shape model of the 24-landmark configuration proposes a correction, and a learned per-landmark gate in [0, 1] decides how much of it to apply — conservative calibration anchored to the Stage-2b prediction.

Results

On the 40-patient locked test set, the full pipeline reaches 2.91 mm mean radial error over all 24 landmarks (95% CI 2.73–3.11 mm), with gross failures above 10 mm in only 0.7% of instances. It outperforms generic point-cloud encoders, a strong coarse-to-local comparator, and a global-descriptor PCA-ridge statistical-shape baseline under the same locked split — the low-dimensional shape model alone (6.91 mm) is clearly insufficient for the surface-to-skeleton mapping.

Method MRE (mm) ↓ SDR@3 (%) ↑ SDR@5 (%) ↑ P95 (mm) ↓ Fail@10 (%) ↓
Training-mean landmarks8.698.622.817.7931.5
Global-desc. PCA-ridge6.9111.735.213.6518.4
PointNet++3.9040.176.38.061.5
PointNeXt3.8040.077.67.781.7
PointMAE5.2218.251.89.663.9
PTv33.7942.876.87.901.9
Sonata/PTv3 (Stage 1)3.6146.979.97.841.7
PTv3 + PointNeXt ROI3.1457.785.56.721.4
Full pipeline (ours)2.9162.788.06.500.7

Held-out test performance over all 24 landmarks on the 40-patient locked test set. All baselines use the same split, registered coordinates, and point samples.

Observability group n MRE (mm) SDR@3 (%)
G0 Surface soft-tissue32.5678.3
G1 Frontal skeletal82.6368.1
G2 Lateral skeletal43.5048.8
G3 Deep / invisible93.0358.9

Deep landmarks (G3) remain predictable at 3.03 mm: although invisible, their positions are constrained by global craniofacial shape. Lateral landmarks (G2) with variable soft-tissue thickness are the hardest group.

Qualitative Examples

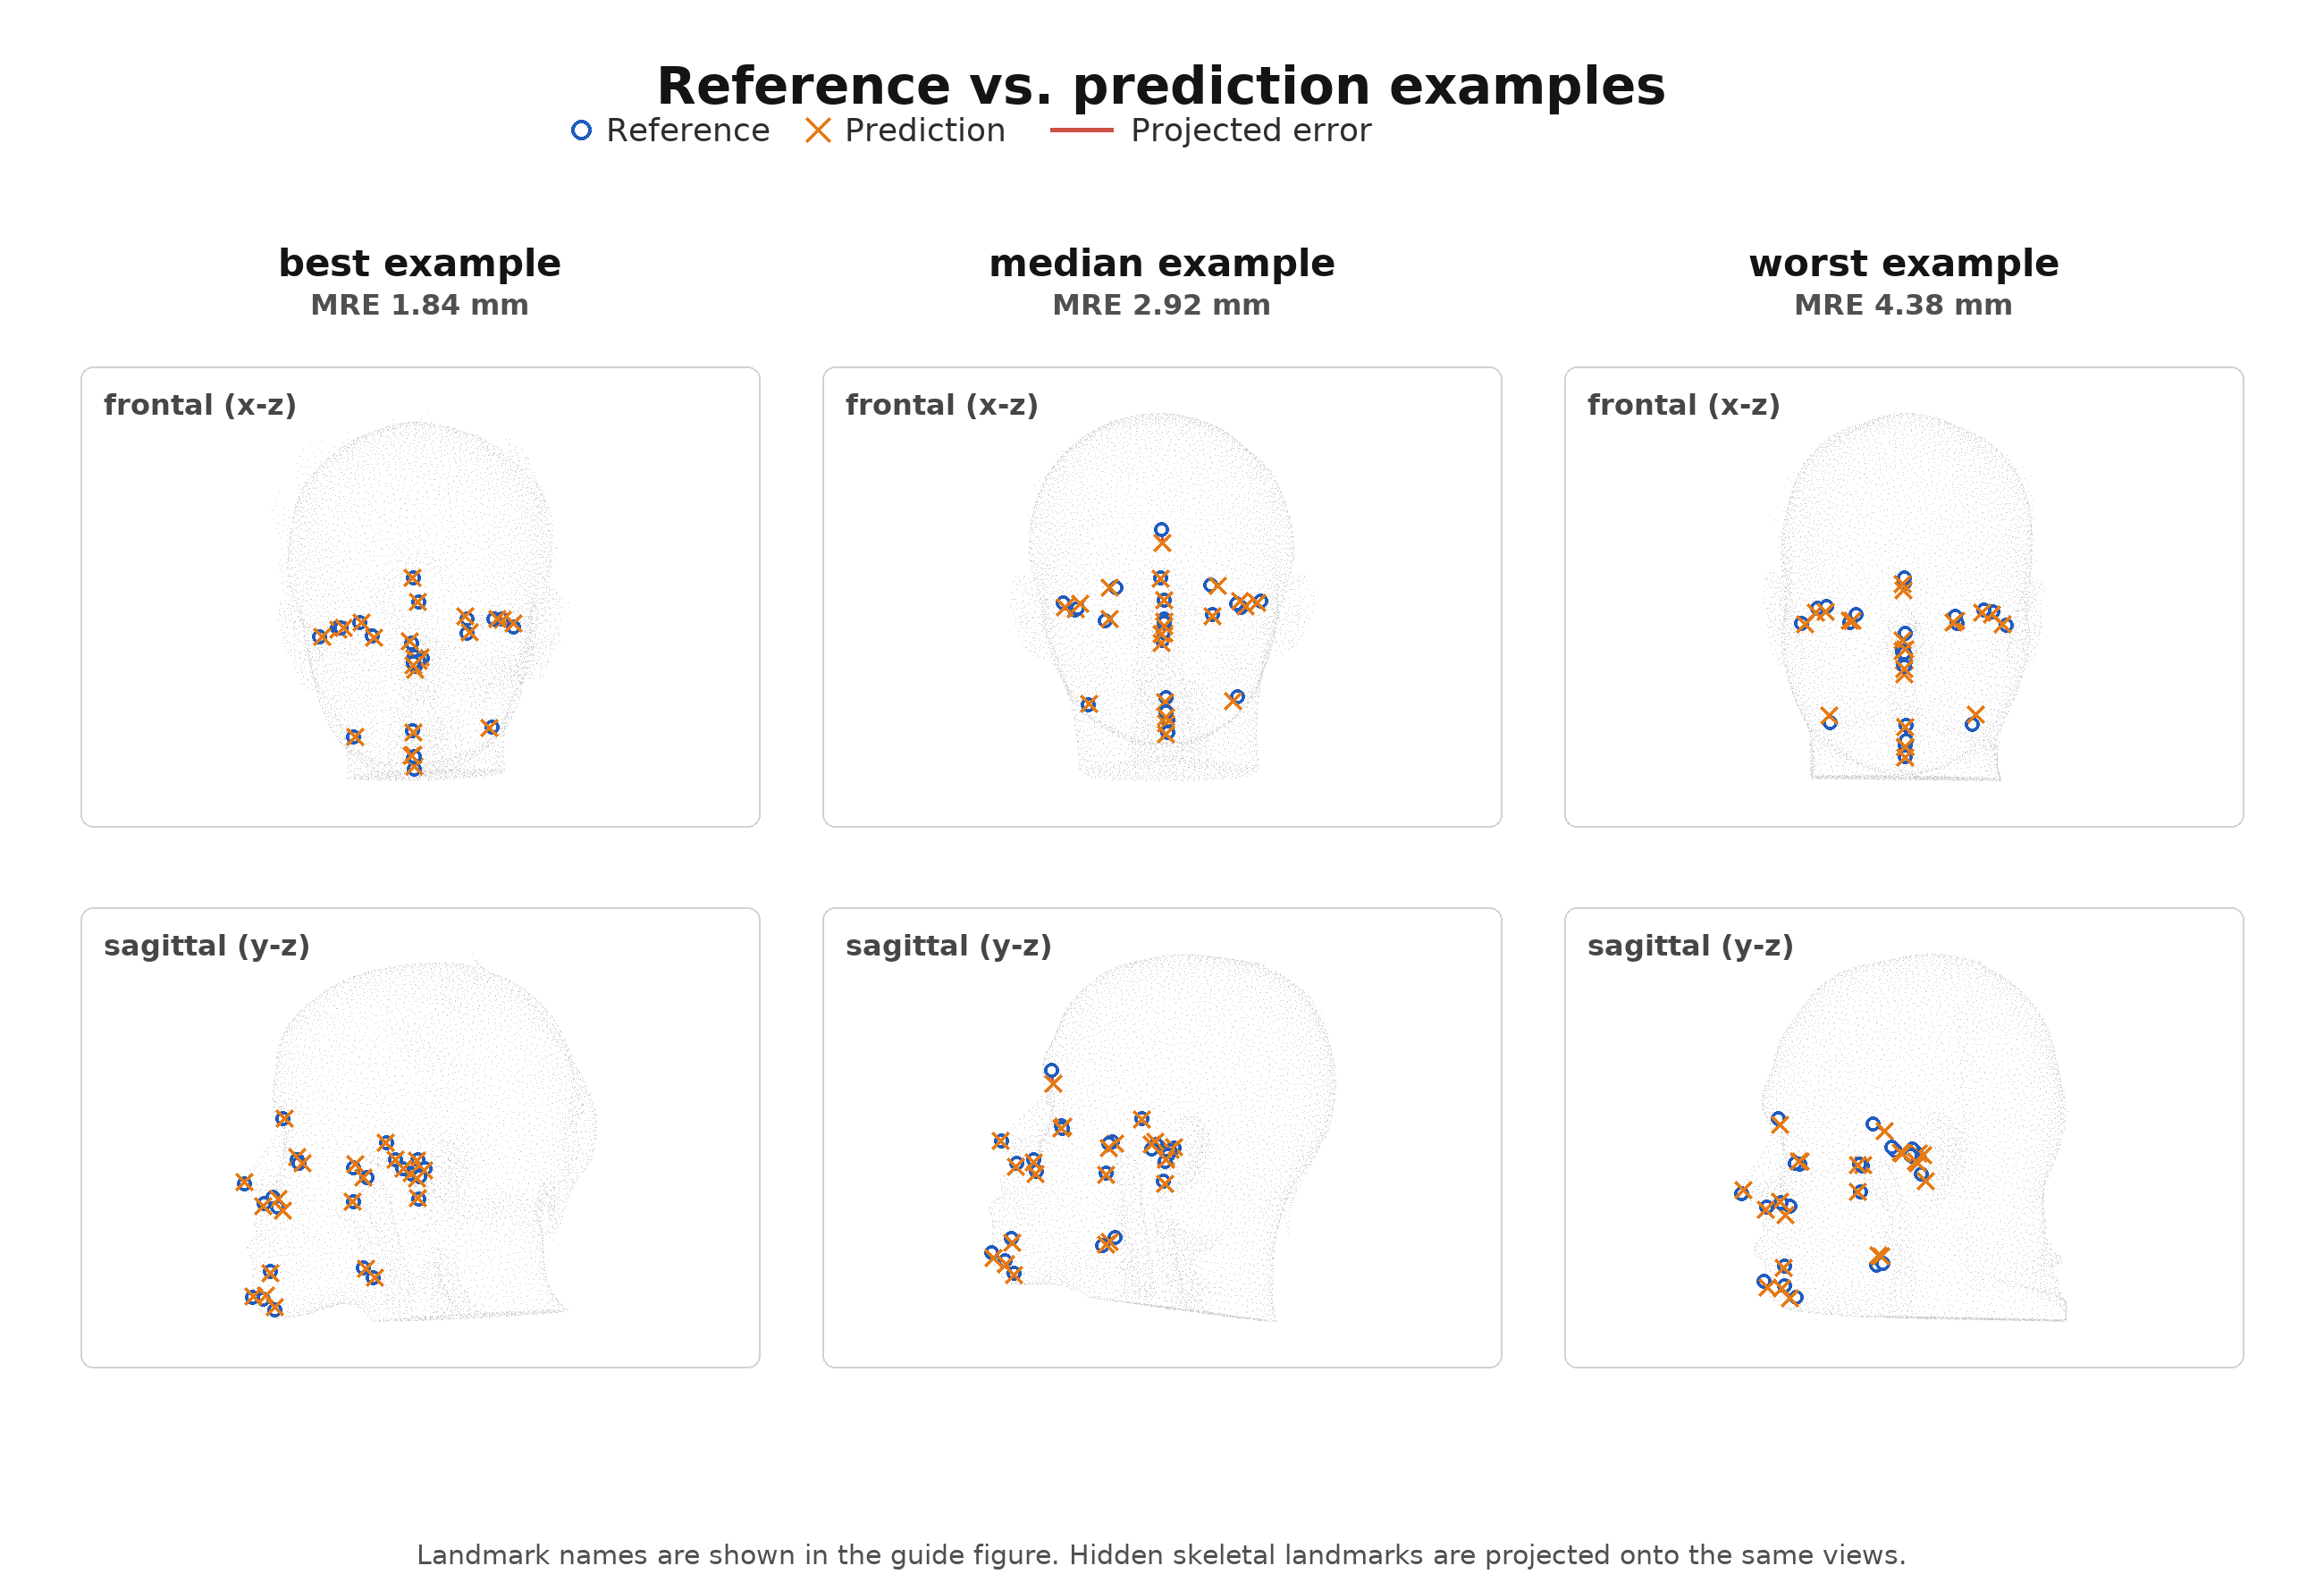
Best, median, and worst test cases showing reference and predicted landmarks projected onto frontal and sagittal views.

Best (1.84 mm), median (2.92 mm), and worst (4.38 mm) held-out cases. Reference (circles) and predicted (crosses) landmarks are projected onto frontal and sagittal views; hidden skeletal landmarks are projected onto the same views.

What the Analyses Show

The signal is patient-specific, not a template

Shuffling predictions across patients raises MRE from 2.91 to 11.87 mm — worse than the training-mean baseline — and a best-fit similarity alignment still leaves 5.36 mm. Matched external geometry carries patient-specific information beyond a fixed population configuration or global similarity, for every observability group including deep landmarks.

The signal is not confined to the front of the face

Frozen anterior-coverage masks degrade performance monotonically: a mild frontal crop costs +0.30 mm, while a tight face-only crop reaches 4.77 mm MRE. Posterior, lateral, and inferior geometry contributes to hidden-landmark inference — a key consideration for future optical capture protocols.

Cephalometric measurements are encouraging but not clinical

ANB reaches 1.22° mean absolute error, and sagittal skeletal class agreement is 34/40 (85%, κ = 0.76). SNA/SNB are less accurate because both depend on deep Sella. This small cohort motivates screening-oriented research but does not establish clinical safety.

Optical transfer remains an open problem

On the eight linked test patients, direct frozen full-pipeline transfer from real Vectra scans yields 10.96 mm patient-level MRE, versus 2.79 mm for clean CT-derived inputs. Separately, across all 14 Vectra scans, coverage-standardized CT-only retraining improves scan-level Stage-1 transfer from 12.40 to 7.94 mm. Diagnostics reveal a large global-configuration component — but deployable local correspondence in the optical domain is unresolved.

Scope, Limitations & Data

This study answers a controlled feasibility question, not a clinical deployment question. It provides a coordinate-consistent reference protocol for staged translation toward radiation-free cephalometry — it is not evidence for immediate screening, triage, or follow-up use, and CT remains necessary whenever internal anatomy must be directly visualized.

  • Inputs are CT-derived surfaces; inference from independently acquired optical scans is a separate, unresolved transfer problem.
  • Errors are measured against finalized consensus annotations, not an observer-independent anatomical truth; protocol-matched observer reliability is future work.
  • The cohort comprises 240 patients with dentofacial deformity referred for initial orthognathic planning at two hospitals belonging to one institution. The pooled 40-case test split is neither site-held-out nor external validation; broader prospective cohorts are needed before generalization can be established.
  • Per-case hospital, scanner, age, sex, and BMI labels were unavailable after anonymization, precluding center-held-out and demographic subgroup analyses.
  • The study was approved by the Tokyo Dental College Ethics Committee (approval no. 1091), written informed consent was obtained, and no CT was acquired solely for this study.
  • Model definitions and evaluation code are publicly available. The retrospective clinical CT data are not publicly released for patient-privacy reasons; the “locked protocol” denotes a fixed split and analysis plan, not a data release.

Acknowledgements

This work was partially supported by JSPS KAKENHI Grant Numbers 23K28112 and 24K13203.

BibTeX

@InProceedings{abe2026surface2skeleton,
  author    = {Abe, Tomoki and Kanaya, Taiki and Saita, Kazuki and Noda, Mao and Tachiki, Chie and Nishii, Yasushi and Saito, Hideo},
  title     = {Surface-to-Skeleton 3D Cephalometry: Estimating Hidden Skeletal Landmarks from CT-Derived External Soft-Tissue Surfaces},
  booktitle = {Proceedings of the European Conference on Computer Vision (ECCV) Workshops},
  month     = {September},
  year      = {2026}
}